- Analytics
- Technical Analysis
Natural Gas vs Oil Technical Analysis - Natural Gas vs Oil Trading: 2023-06-27
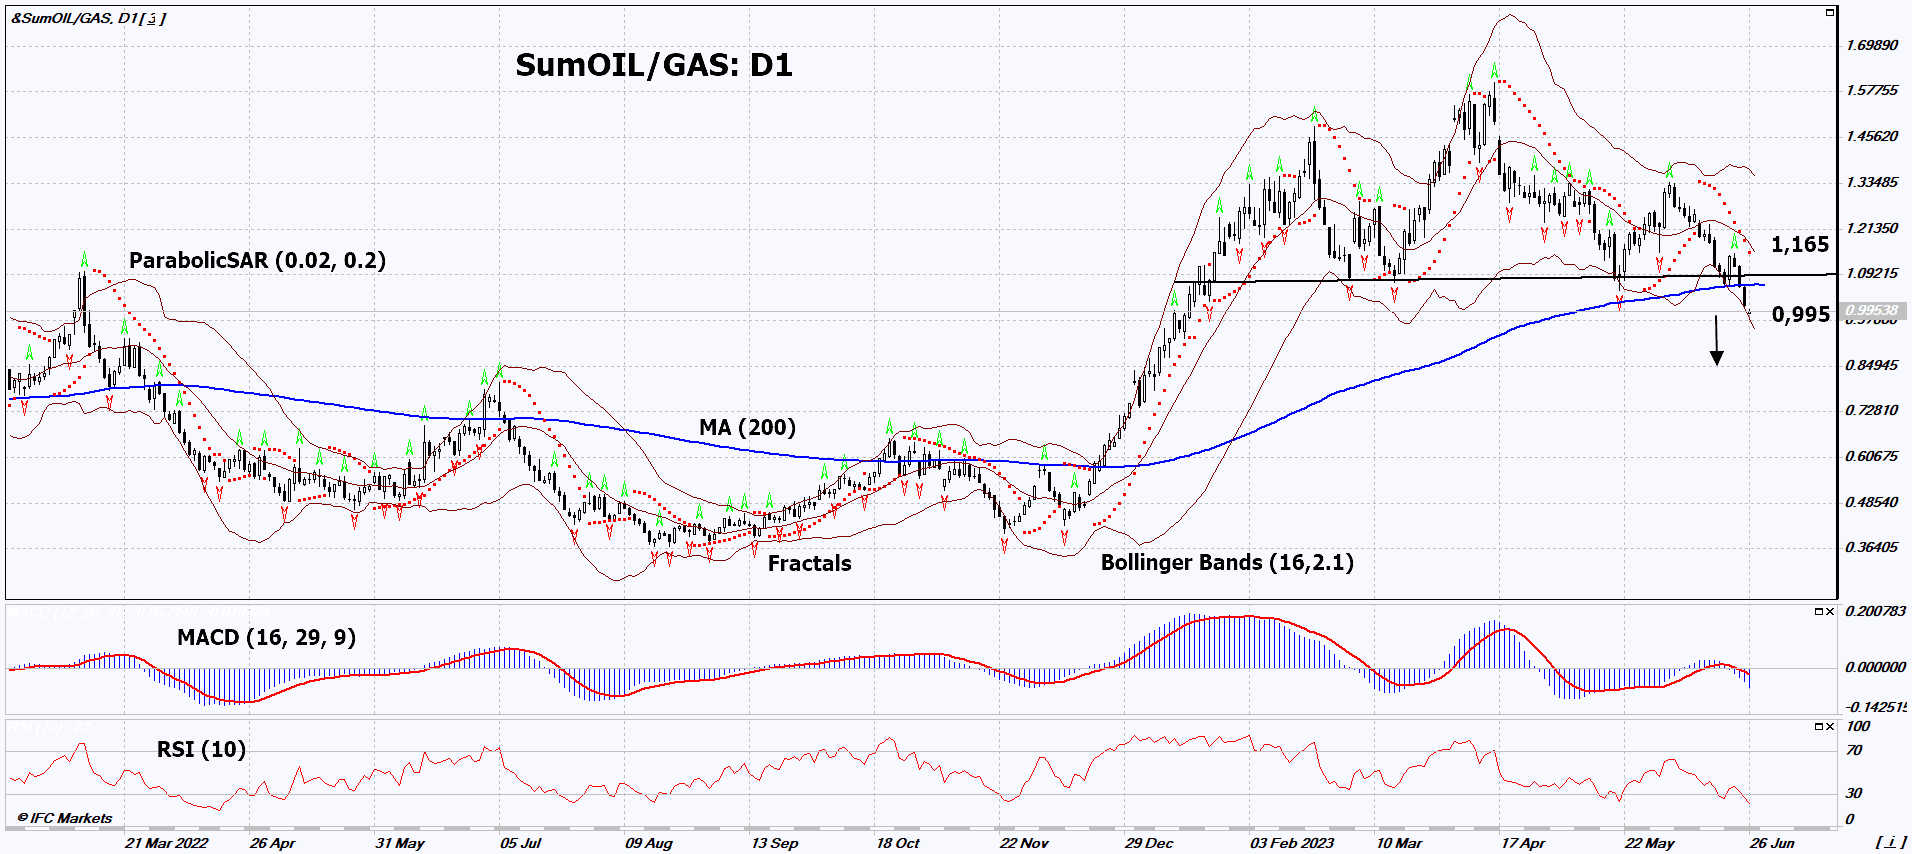
Oil vs Gas Technical Analysis Summary
Below 0.995
Sell Stop
Above 1.165
Stop Loss
| Indicator | Signal |
| RSI | Neutral |
| MACD | Sell |
| MA(200) | Sell |
| Fractals | Sell |
| Parabolic SAR | Sell |
| Bollinger Bands | Neutral |
Oil vs Gas Chart Analysis
Oil vs Gas Technical Analysis
On the daily timeframe, SumOIL/GAS: D1 exited the Head and Shoulders pattern and broke down the 200-day moving average line. A number of technical analysis indicators formed signals for further decline. We do not rule out a bearish movement if SumOIL/GAS: D1 drops below the latest low: 0.995. This level can be used as an entry point. Initial risk limit possible above last up fractal and Parabolic signal: 1.165. After opening a pending order, we move the stop following the Bollinger and Parabolic signals to the next fractal maximum. Thus, we are changing the potential profit/loss ratio in our favor. After making a trade, the most cautious traders can switch to a four-hour chart and set a stop loss, moving it in the direction of movement. If the price overcomes the stop level (1.165) without activating the order (0.995), it is recommended to delete the order: there are internal changes in the market that were not taken into account.
Fundamental Analysis of PCI - Oil vs Gas
In this review, we propose to consider the Personal Composite Instrument (PCI) &SumOIL/GAS. It reflects the price dynamics of a portfolio of futures for oil of two grades - Brent and WTI against a futures for natural gas. Will SumOIL/GAS quotes drop?
The downward movement means that US gas is rising in price faster than oil. A significant factor in the increase in demand for gas may be the resumption of operation of the Freeport LNG terminal, which suffered last year due to an accident. As of last week, U.S. LNG exports amounted to 10.7 billion cubic feet per day. According to the U.S. Energy Information Administration (EIA), in 2023 it will reach 12.07 billion cubic feet per day. Note that the EIA expects a 4.7% increase in US gas production this year to 102.74 billion cubic feet per day. At the same time, according to oilfield services company Baker Hughes, the number of gas drilling rigs in the US has not changed over the past week and is now at a 15-month low of 130 units.
Note:
This overview has an informative and tutorial character and is published for free. All the data, included in the overview, are received from public sources, recognized as more or less reliable. Moreover, there is no guarantee that the indicated information is full and precise. Overviews are not updated. The whole information in each overview, including opinion, indicators, charts and anything else, is provided only for familiarization purposes and is not financial advice or а recommendation. The whole text and its any part, as well as the charts cannot be considered as an offer to make a deal with any asset. IFC Markets and its employees under any circumstances are not liable for any action taken by someone else during or after reading the overview.


