- Education
- Forex Technical Analysis
- Technical Indicators
- Bill Williams Indicators
- Awesome Oscillator
Awesome Oscillator - AO Indicator
Understanding market momentum is crucial for making informed decisions. The Awesome Oscillator, a creation of Bill Williams, emerges as a powerful tool in trading. By analyzing the difference between two distinct average prices—namely the 34-period and 5-period Simple Moving Averages (SMA)—over a defined period, this tool paints a vivid picture of market dynamics.
As we dive deeper, we'll simplify the Awesome Oscillator concept with relatable examples and explore its formula and calculation intricacies. In addition, we'll unravel its role in identifying bullish and bearish momentum, potential reversals, and overbought or oversold conditions.
Discover an awesome oscillator strategy to make informed decisions. Let’s start!
How to use Awesome Oscillator in trading platform
KEY TAKEAWAYS
- The Awesome Oscillator is a tool used in trading to figure out how the market's momentum is changing.
- The Awesome Oscillator can be used to identify bullish and bearish momentum, as well as potential reversals.
- The Awesome Oscillator is a valuable tool for technical traders, but it is important to use it wisely and in conjunction with other indicators.
What is Awesome Oscillator
The Awesome Oscillator is a tool used in trading to figure out how the market's momentum is changing. It was created by Bill Williams. Basically, it looks at the difference between two types of average prices (34-period and a 5-period (SMA)) over a certain time.
This makes bars on a chart that show if things are going up or down. When the bars are above a line, it means things are going up, and when they're below, it means things are going down. This helps traders know if the market's getting stronger or weaker, which can help them decide when to buy or sell.
Let me explain the Awesome Oscillator in simpler terms with some examples:
Imagine you're trying to figure out if a car is speeding up or slowing down. The Awesome Oscillator works in a similar way for trading, telling you if the market's momentum is getting stronger or weaker.
Picture a line on a chart that shows the average price of a financial asset (like a stock) over the past 34 periods (which could be days or hours). Then, there's another line that shows the average price over the past 5 periods.
These lines help us understand the recent price trends.
Now, the Awesome Oscillator takes the average of these two lines and makes green and red bars on the chart. Green bars indicate bullish momentum, while red bars indicate bearish momentum. If the bar is above a horizontal line at zero, it means the market's momentum is going up.
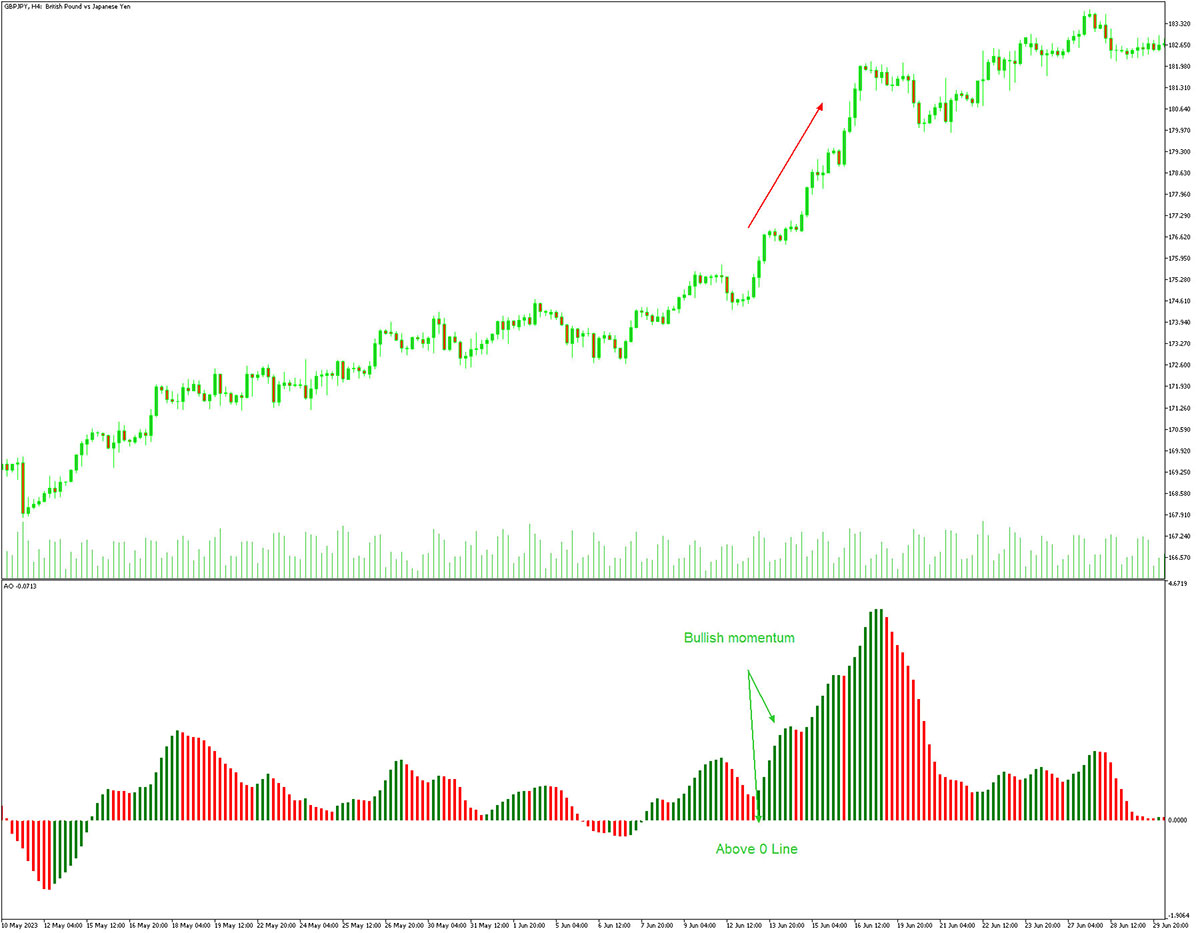
On the other hand, if the bar is below the zero line, it means the momentum is going down.
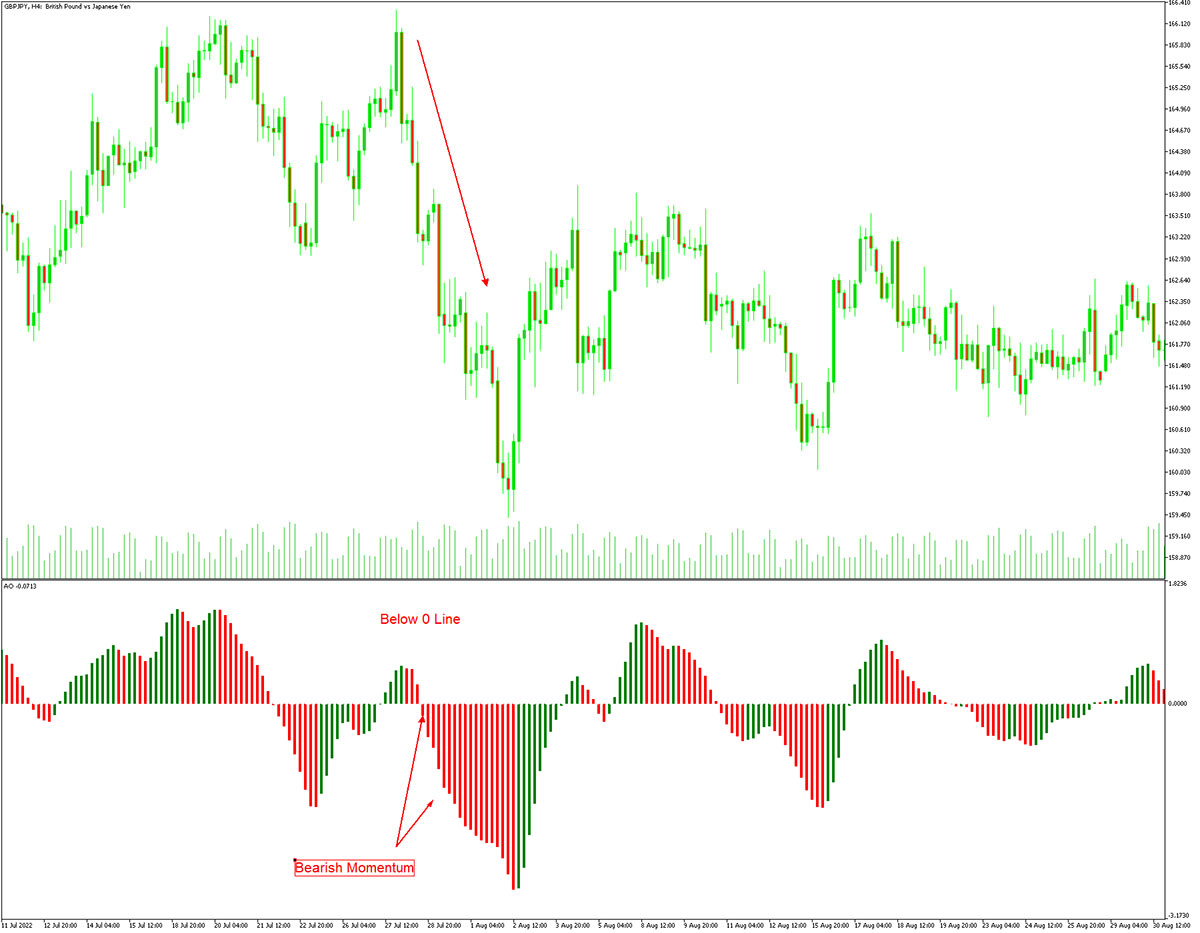
For example, let's say you're looking at the Awesome Oscillator bars for a stock, and you see that the bars are getting bigger and moving above the zero line. This suggests that the stock's momentum is picking up. Traders might see this as a sign to buy the stock because it could keep going up.
Conversely, if you notice the bars getting smaller and going below the zero line, it could mean the stock's momentum is weakening. Traders might consider selling or being cautious about buying more.
In summary, the Awesome Oscillator is like a speedometer for the market. It helps traders spot changes in momentum, whether it's speeding up (bullish) or slowing down (bearish). By paying attention to these changes, traders can make smarter decisions about when to make their moves in the financial world.
Awesome Oscillator Formula
The Awesome Oscillator (AO) is a technical indicator that was developed by Bill Williams to measure market momentum. It is calculated by taking the difference between a 34-period and 5-period simple moving average of the midpoint of the price range for each period. The AO is displayed as a histogram with a zero line in the middle.
The Awesome Oscillator formula is as follows:
AO = 5 - period SMA of median price - 34 - period SMA of median price
Where:
SMA = Simple Moving AverageMedian Price = (High + Low)/2
The Awesome Oscillator can be used to identify bullish and bearish momentum, as well as potential reversals. A bullish crossover occurs when the AO crosses above the zero line, while a bearish crossover occurs when the AO crosses below the zero line. Additionally, the AO can be used to identify overbought and oversold conditions.
Here are some examples of how the Awesome Oscillator can be used:
- To identify bullish and bearish momentum: A rising AO indicates bullish momentum, while a falling AO indicates bearish momentum.
- To identify potential reversals: A bullish crossover of the zero line indicates a potential bullish reversal, while a bearish crossover of the zero line indicates a potential bearish reversal.
- To identify overbought and oversold conditions: The AO can be used to identify overbought and oversold conditions by looking for the AO to reach extreme levels.
Tips for Using the Awesome Oscillator
- Use the AO in conjunction with other indicators to confirm signals.
- Consider the AO's direction and momentum when making trading decisions.
- Be aware of the AO's limitations and use it accordingly.
The Awesome Oscillator is a valuable tool for technical traders, but it is important to use it wisely and in conjunction with other indicators.
Awesome Oscillator Calculation
The Awesome Oscillator (AO) is a technical indicator that was developed by Bill Williams to measure market momentum. It is calculated by taking the difference between a 34-period and 5-period simple moving average of the midpoint of the price range for each period. The AO is displayed as a histogram with a zero line in the middle.
To calculate the Awesome Oscillator, you will need the following data:
- The closing prices for a specified period of time
- The midpoint of the price range for each period
The midpoint of the price range is calculated by taking the average of the high and low prices for each period.
Once you have the necessary data, you can calculate the Awesome Oscillator using the following steps:
- Calculate the 34-period simple moving average of the midpoint of the price range.
- Calculate the 5-period simple moving average of the midpoint of the price range.
- Subtract the 5-period SMA from the 34-period SMA.
- The result is the Awesome Oscillator value for that period.
The Awesome Oscillator is typically plotted as a histogram with a zero line in the middle. Green bars indicate bullish momentum, while red bars indicate bearish momentum. The AO crosses above the zero line when bullish momentum is increasing. This is a bullish signal. The AO crosses below the zero line when bearish momentum is increasing. This is a bearish signal.
The Awesome Oscillator can be used to identify bullish and bearish momentum, as well as potential reversals. It can also be used to identify overbought and oversold conditions.
How to Use Awesome Oscillator
Let's walk through how to use the Awesome Oscillator with step-by-step examples:
- Understand the Basics
- Setting Up Choose
- Analyzing Bullish Momentum
- Identifying Bearish Momentum
- Spotting Divergence
- Confirming Trends
1. Understand the Basics
The Awesome Oscillator (AO) consists of bars above and below a zero line. Positive bars indicate bullish momentum, while negative bars suggest bearish momentum.
2. Setting Up Choose
Choose a financial instrument and a timeframe (e.g., daily, hourly). Open a chart for that instrument and apply the Awesome Oscillator indicator. The default settings usually work well, but you can adjust them if needed.
3. Analyzing Bullish Momentum
Imagine you're looking at the AO bars for a stock, and you see a series of positive bars above the zero line. This suggests that the stock's momentum is shifting towards the bullish side.
Example:
If you're trading stocks and you notice the AO bars turning positive after a period of decline, it could signal a potential reversal or a bullish trend. This might be a good time to consider buying the stock.
4. Identifying Bearish Momentum
Now, let's say you observe negative AO bars below the zero line. This indicates that the market's momentum is leaning towards the bearish side.
Example:
If you're trading forex and notice the AO bars becoming negative after a period of uptrend, it could suggest that the momentum is shifting towards a downtrend. This might prompt you to consider selling the currency pair.
5. Spotting Divergence
Divergence occurs when the price and the AO bars move in opposite directions.
- Positive divergence happens when the price makes lower lows but the AO makes higher lows, indicating potential bullish reversal.
- Negative divergence is when the price makes higher highs but the AO makes lower highs, suggesting possible bearish reversal.
Example:
If you're trading cryptocurrencies and you see the price of a coin making lower lows, but the AO bars are showing higher lows, it could signal that the downtrend might be weakening and a bullish reversal could be on the horizon.
6. Confirming Trends
You can use the Awesome Oscillator to confirm trends by comparing the direction of the AO bars with the prevailing trend. In a strong uptrend, you'd expect to see mostly positive AO bars, and in a strong downtrend, mostly negative AO bars.
Example: Suppose you're trading commodities and the price has been consistently rising. If the AO bars are predominantly positive during this uptrend, it supports the idea that the upward momentum is intact.
Remember, while the Awesome Oscillator can be a powerful tool, it's not foolproof. Always consider combining it with other indicators and analysis methods to make well-informed trading decisions. Also, practice on a demo account before using it in live trading to ensure you're comfortable with its interpretation.
Awesome Oscillator Strategy
The Awesome Oscillator is a technical indicator that helps traders identify trends and potential reversals in the financial markets. It's based on the simple moving averages of a shorter and a longer period, and it's used to measure market momentum. Here's a basic trading strategy using the Awesome Oscillator:
Strategy: Awesome Oscillator Twin Peaks
This strategy focuses on identifying potential trend reversals using the "Twin Peaks" setup of the Awesome Oscillator.
Indicators:
Awesome Oscillator (AO) - You'll need to have this indicator available on your trading platform.
Rules:
Identify Peaks:
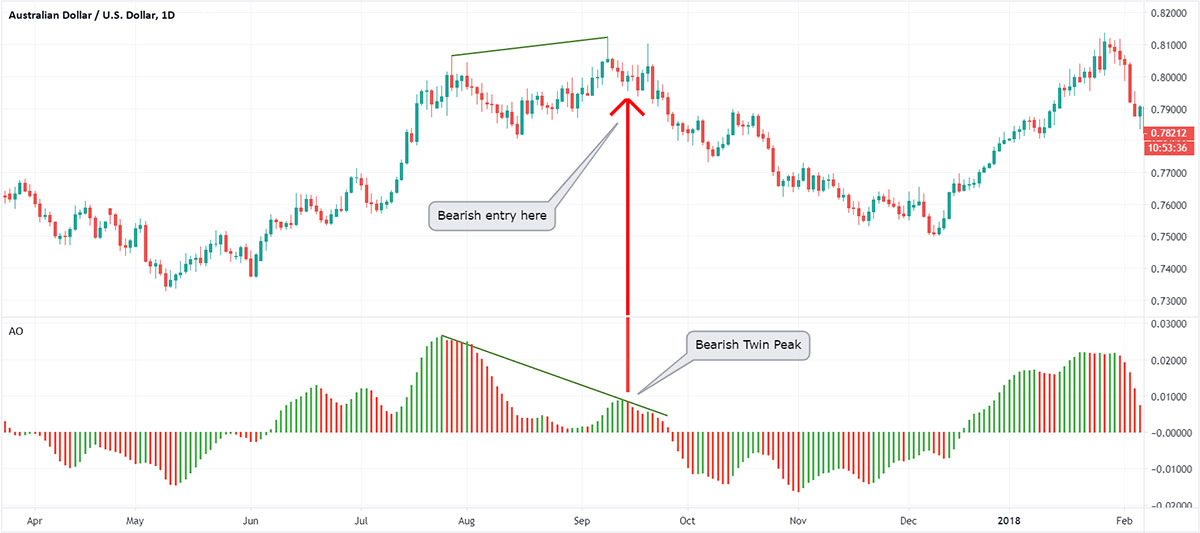
- Look for peaks on the Awesome Oscillator histogram. Peaks occur when the histogram bars change from red to green and then back to red.
- The first peak (higher) is referred to as the "Saucer" and the second peak (lower) is referred to as the "Twin Peak."
- The Saucer is formed when the histogram bars change from red to green, indicating a potential shift from bearish to bullish momentum.
- The Twin Peak is formed when the histogram bars change from green to red after the Saucer, indicating a potential shift back to bearish momentum.
Entry:
- Enter a long (buy) position when the Awesome Oscillator histogram has formed a Saucer (first peak) followed by a Twin Peak (second peak).
- Enter a short (sell) position when the Awesome Oscillator histogram has formed a Saucer (first peak) followed by a Twin Peak (second peak) in the opposite direction.
Confirmation:
- Consider using additional technical indicators or chart patterns to confirm the potential reversal before entering a trade. This could include trendlines, support/resistance levels, or other momentum indicators.
Stop Loss:
- Place a stop loss below the recent swing low (for long positions) or above the recent swing high (for short positions) to limit potential losses.
Take Profit:
- Set a take profit level based on your risk-reward ratio or technical targets. This could be a previous support/resistance level or a certain number of pips.
Risk Management:
- Only risk a small percentage of your trading capital on each trade to manage risk.
There are other trading strategies that incorporate the Awesome Oscillator in different ways. Here are a couple of additional Awesome Oscillator strategies:
Saucer Strategy:
This strategy focuses on identifying potential trend changes based on the Saucer setup of the Awesome Oscillator.
Rules:
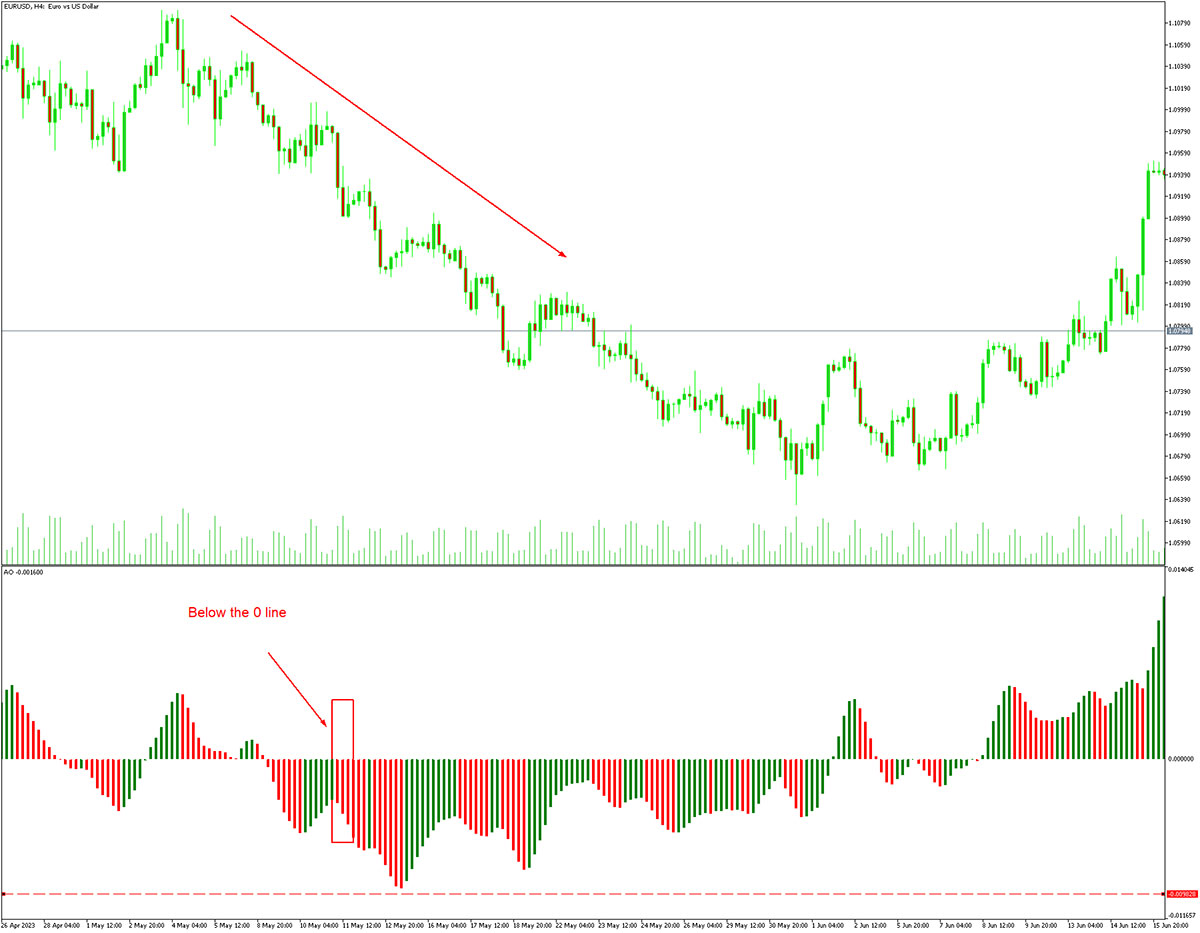
- A bullish signal is generated when the histogram bars change from red to green, indicating a shift from bearish momentum to bullish momentum.
The Awesome Oscillator should be above the zero line, indicating positive momentum. The first bar must be red. The second bar must be red and lower than the first bar. The third bar must be green and higher than the second bar.
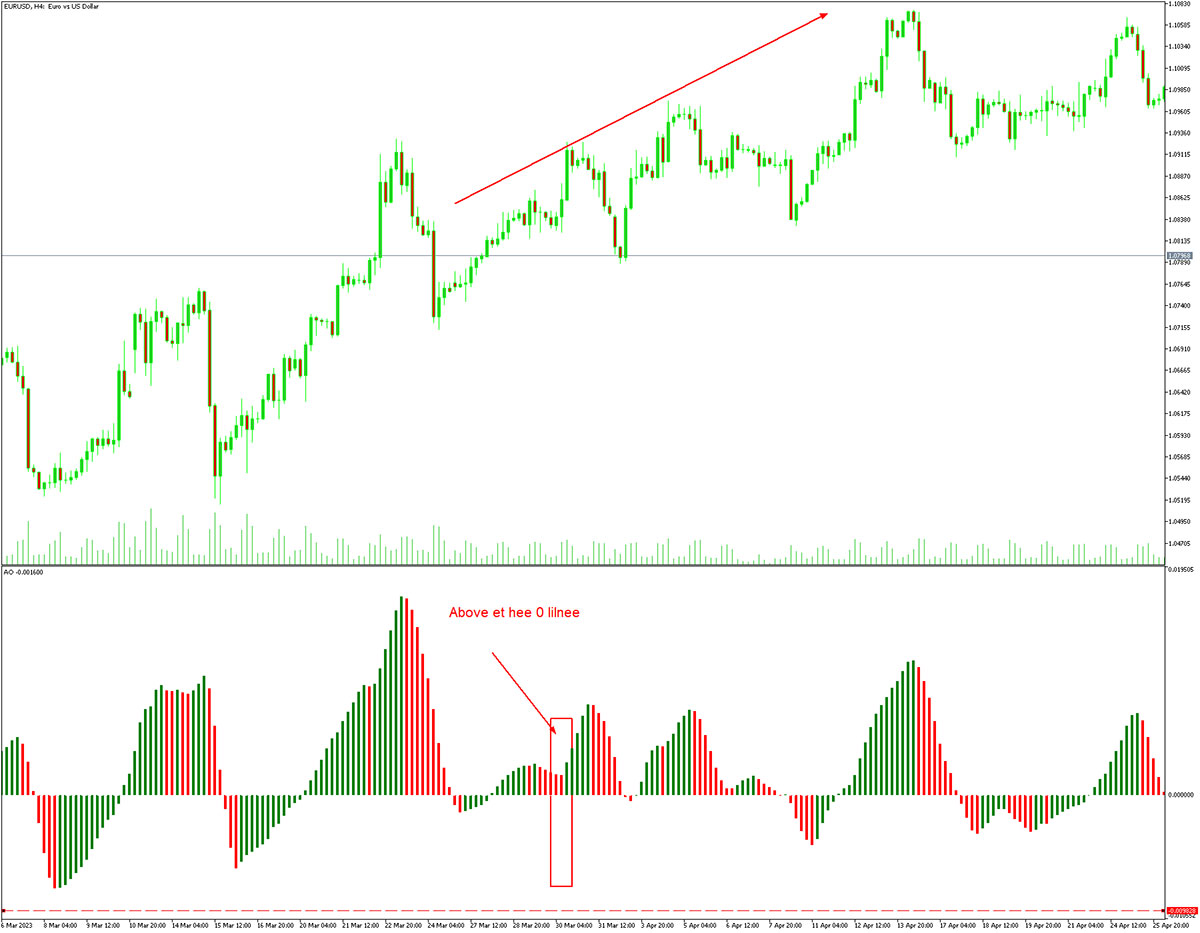
- Traders might consider entering a long position when the Saucer setup is confirmed by other technical indicators or price patterns.
- A bearish signal is generated when the histogram bars change from green to red, indicating a shift from bullish momentum to bearish momentum.
- The Awesome Oscillator should be below the zero line, indicating negative momentum.
Traders might consider entering a short position when the Saucer setup is confirmed by other technical indicators or price patterns.
Zero Line Crossover Strategy:
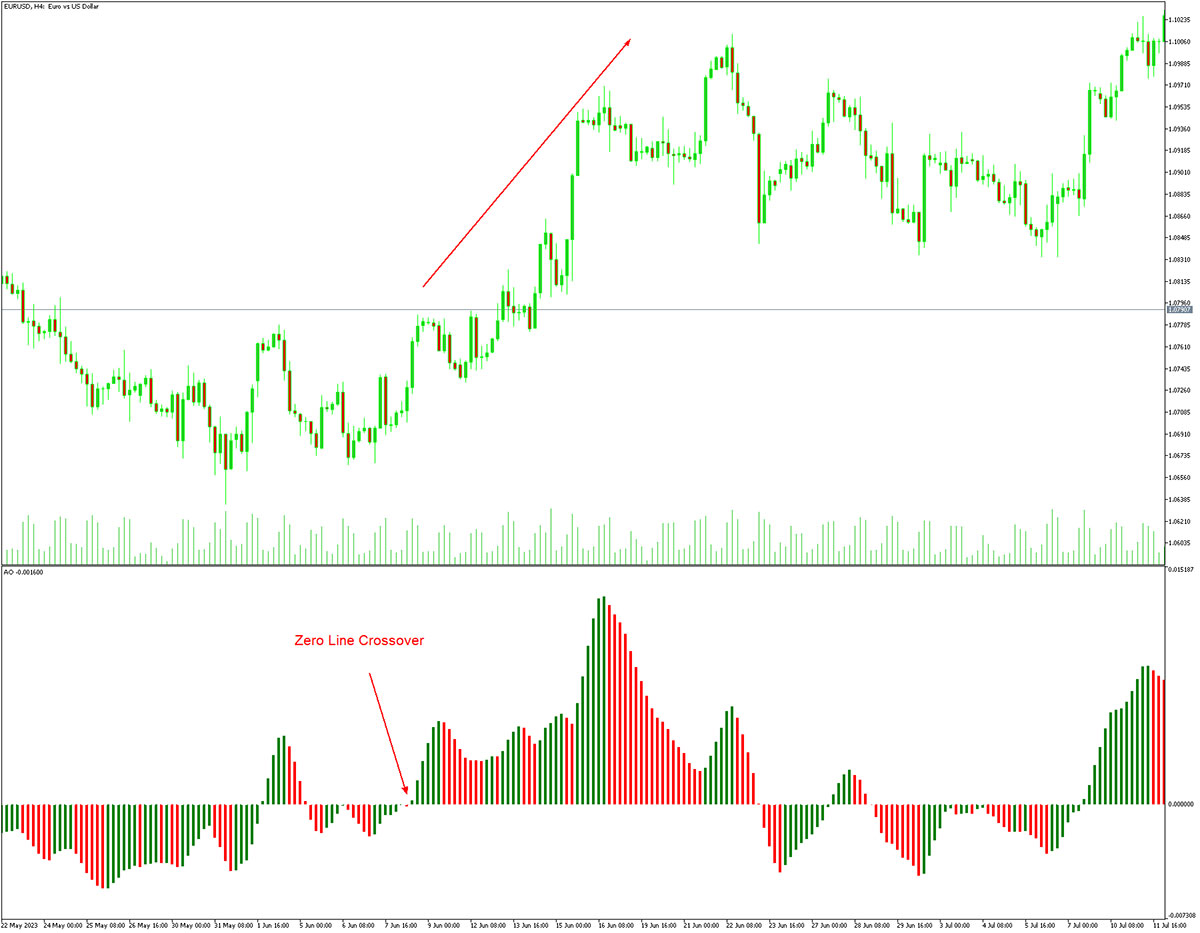
This strategy involves trading based on crossovers of the Awesome Oscillator's histogram bars with the zero line.
Rules:
- When the histogram bars cross above the zero line and turn green, it indicates a potential shift from bearish to bullish momentum. Traders might consider entering long positions.
- When the histogram bars cross below the zero line and turn red, it indicates a potential shift from bullish to bearish momentum. Traders might consider entering short positions.
Traders can use this strategy in conjunction with other indicators or price patterns to increase the accuracy of their trades.
Divergence Strategy:
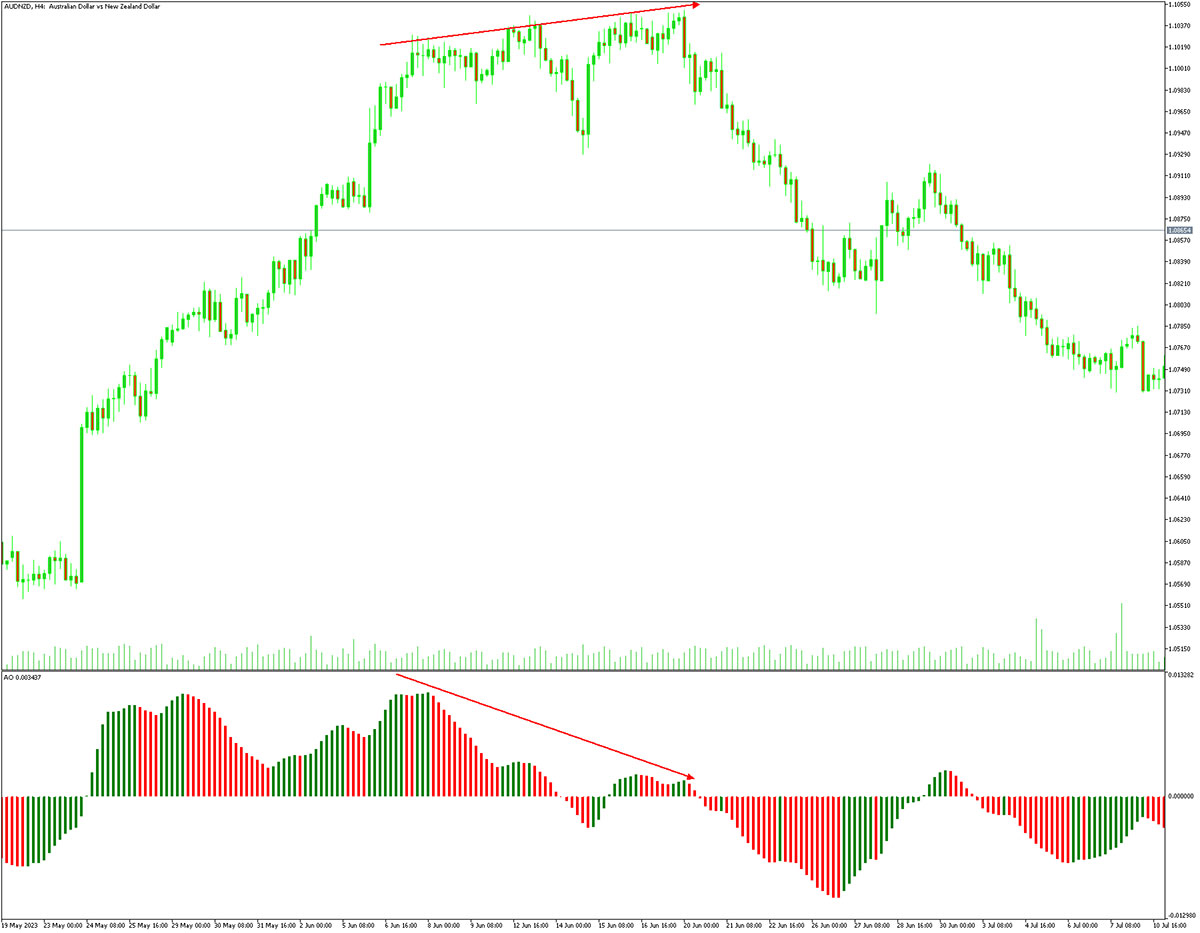
Divergence occurs when the price of an asset is moving in the opposite direction of the Awesome Oscillator. It can be a potential signal of a trend reversal.
Rules:
- Bullish Divergence: Look for situations where the price is making lower lows, but the Awesome Oscillator is making higher lows. This might indicate that bearish momentum is weakening, and a bullish reversal could be imminent.
- Bearish Divergence: Look for situations where the price is making higher highs, but the Awesome Oscillator is making lower highs. This might indicate that bullish momentum is weakening, and a bearish reversal could be imminent.
Traders often use additional confirmation from other indicators or chart patterns before entering trades based on divergence.
Remember that no trading strategy is bulletproof, and it's important to practice risk management, conduct thorough analysis, and adapt your strategy to the specific market conditions.
Bottom Line on Awesome Oscillator
The Awesome Oscillator, a creation of Bill Williams, stands as a robust trading tool for gauging momentum and identifying trends. Through its calculation of SMAs and depiction of bar dynamics, it provides traders with insights into market strength and weakness.
While its role in signaling reversals and extreme conditions is valuable, it's vital to integrate it with other indicators and exercise prudent decision-making. Understanding and effectively employing the Awesome Oscillator can enhance trading strategies and outcomes.
Forex Indicators FAQ
What is a Forex Indicator?
Forex technical analysis indicators are regularly used by traders to predict price movements in the Foreign Exchange market and thus increase the likelihood of making money in the Forex market. Forex indicators actually take into account the price and volume of a particular trading instrument for further market forecasting.
What are the Best Technical Indicators?
Technical analysis, which is often included in various trading strategies, cannot be considered separately from technical indicators. Some indicators are rarely used, while others are almost irreplaceable for many traders. We highlighted 5 the most popular technical analysis indicators: Moving average (MA), Exponential moving average (EMA), Stochastic oscillator, Bollinger bands, Moving average convergence divergence (MACD).
How to Use Technical Indicators?
Trading strategies usually require multiple technical analysis indicators to increase forecast accuracy. Lagging technical indicators show past trends, while leading indicators predict upcoming moves. When selecting trading indicators, also consider different types of charting tools, such as volume, momentum, volatility and trend indicators.
Do Indicators Work in Forex?
There are 2 types of indicators: lagging and leading. Lagging indicators base on past movements and market reversals, and are more effective when markets are trending strongly. Leading indicators try to predict the price moves and reversals in the future, they are used commonly in range trading, and since they produce many false signals, they are not suitable for trend trading.

