- Education
- Forex Technical Analysis
- Technical Indicators
- Trend Indicators
- Parabolic SAR
Parabolic SAR Indicator
What is Parabolic SAR
How to Use Parabolic SAR
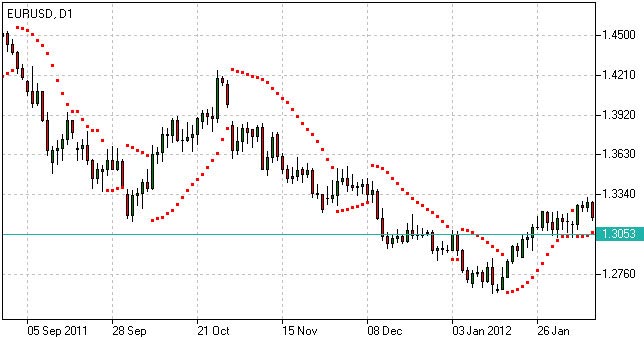
When using Parabolic SAR indicator we should take into consideration its positioning against the price chart as well as its acceleration factor which increases together with the trend. Despite being a popular tool of analysis, it has limitations and may give false signals in frequently changing market conditions.
The indicator may signal the following:
Trend confirmation
- If the indicator is plotted below the price graph, it stands for an uptrend;
- If the indicator is plotted above the price graph, it confirms a downtrend.
Exit points determination
- If the price drops below Parabolic line during an uptrend, there may be sense in closing long positions;
- If the price rises above Parabolic curve during a downtrend, there may be sense in closing short positions.
Signal significance is determined with the use of the acceleration factor. The acceleration factor increases each time the close price is higher than its previous value in an uptrend and lower in a downtrend. It is believed that the indicator is more reliable when the price’s and the indicator’s moves are parallel and less reliable when they converge.

Parabolic SAR Indicator
Parabolic SAR Calculation
To calculate the Parabolic indicator, the acceleration factor is multiplied by the difference between the low/high prices and the previous period of SAR. Then, the obtained result in case of the falling SAR is subtracted from the SAR value of the previous period, and in case of the rising SAR, added to the SAR value of the previous period.
Parabolic SAR formula:
P(t) = P(t-1) + AF x (EP(t-1) – P(t-1))In the Parabolic SAR formula, the P(t) is the current value of the indicator, the P(t-1) is the value in the previous period, the AF is acceleration factor, generally rising from 0.02 to 0.2 with a step of 0.02, the EP(t-1) is the extreme price in the previous period.
How to use Parabolic SAR in trading platform
Forex Indicators FAQ
What is a Forex Indicator?
Forex technical analysis indicators are regularly used by traders to predict price movements in the Foreign Exchange market and thus increase the likelihood of making money in the Forex market. Forex indicators actually take into account the price and volume of a particular trading instrument for further market forecasting.
What are the Best Technical Indicators?
Technical analysis, which is often included in various trading strategies, cannot be considered separately from technical indicators. Some indicators are rarely used, while others are almost irreplaceable for many traders. We highlighted 5 the most popular technical analysis indicators: Moving average (MA), Exponential moving average (EMA), Stochastic oscillator, Bollinger bands, Moving average convergence divergence (MACD).
How to Use Technical Indicators?
Trading strategies usually require multiple technical analysis indicators to increase forecast accuracy. Lagging technical indicators show past trends, while leading indicators predict upcoming moves. When selecting trading indicators, also consider different types of charting tools, such as volume, momentum, volatility and trend indicators.
Do Indicators Work in Forex?
There are 2 types of indicators: lagging and leading. Lagging indicators base on past movements and market reversals, and are more effective when markets are trending strongly. Leading indicators try to predict the price moves and reversals in the future, they are used commonly in range trading, and since they produce many false signals, they are not suitable for trend trading.
Use indicators after downloading one of the trading platforms, offered by IFC Markets.

Not sure about your Forex skills level?
Take a Test and We Will Help You With The Rest


