- 分析
- 技術分析
澳大利亞股指 技術分析 - 澳大利亞股指 交易: 2025-04-29
澳大利亞股指 技術分析總結
高於 8079.03
Buy Stop
低於 7970.52
Stop Loss
| 指標 | 信號 |
| RSI | 賣出 |
| MACD | 買進 |
| Donchian Channel | 買進 |
| MA(200) | 買進 |
| Fractals | 買進 |
| Parabolic SAR | 買進 |
澳大利亞股指 圖表分析
澳大利亞股指 技術分析
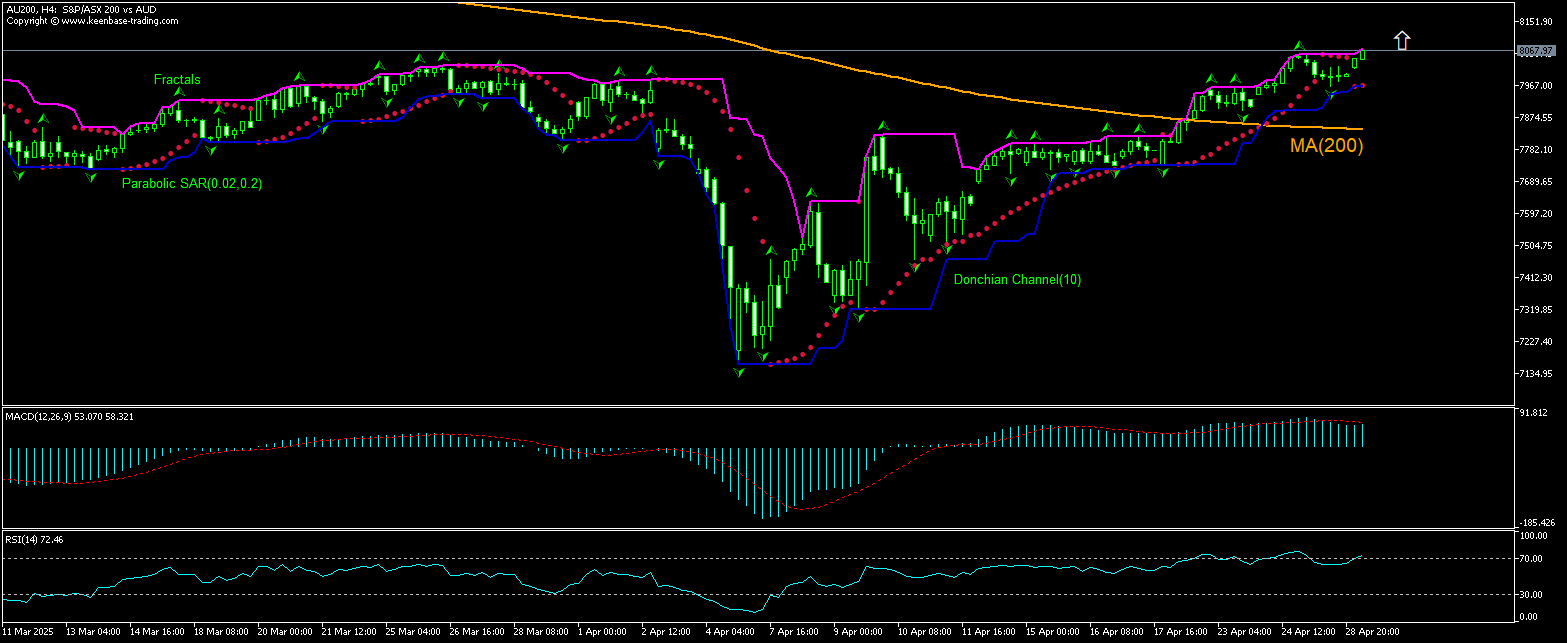
The AU200 technical analysis of the price chart on 4-hour timeframe shows AU200,H4 is rising above the 200-period moving average MA(200) after returning above the MA(200) following a rebound three weeks ago. The RSI indicator is in overbought zone. We believe the bullish momentum will continue after the price breaches above the upper Donchian boundary at 8079.03. This level can be used as an entry point for placing a pending order to buy. The stop loss can be placed below 7970.52. After placing the pending order the stop loss is to be moved every day to the next fractal low indicator, following Parabolic signals. Thus, we are changing the expected profit/loss ratio to the breakeven point. If the price meets the stop-loss level (7970.52) without reaching the order (8079.03) we recommend cancelling the order: the market sustains internal changes which were not taken into account.
指數 基本面分析 - 澳大利亞股指
Market participants expect inflation in Australia will ease. Will the AU200 price rebound persist ?
Investors expect Australia’s annual inflation rate to fall to 2.3% in Q1, easing from 2.4% in Q4. Markets are pricing in a quarter-point rate cut by the Reserve Bank of Australia in May against the backdrop of continuing concerns over the global trade environment driven by US tariff policy uncertainties. If price data confirm consumer inflation in Australia continues declining, investors expect the central bank will have more justification for monetary easing which will provide more support for stock prices. Expectations of easing Australian consumer inflation are bullish for AU200 stock index.
附注:
本文針對宣傳和教育, 是免費讀物. 文中所包含的資訊來自於公共管道. 不保障資訊的完整性和準確性. 部分文章不會更新. 所有的資訊, 包括觀點, 指數, 圖表等等僅用於介紹, 不能用於財務意見和建議. 所有的文字以及圖表不能作為交易的建議. IFC Markets及員工在任何情況下不會對讀者在閱讀文章中或之後採取的行為負責.


